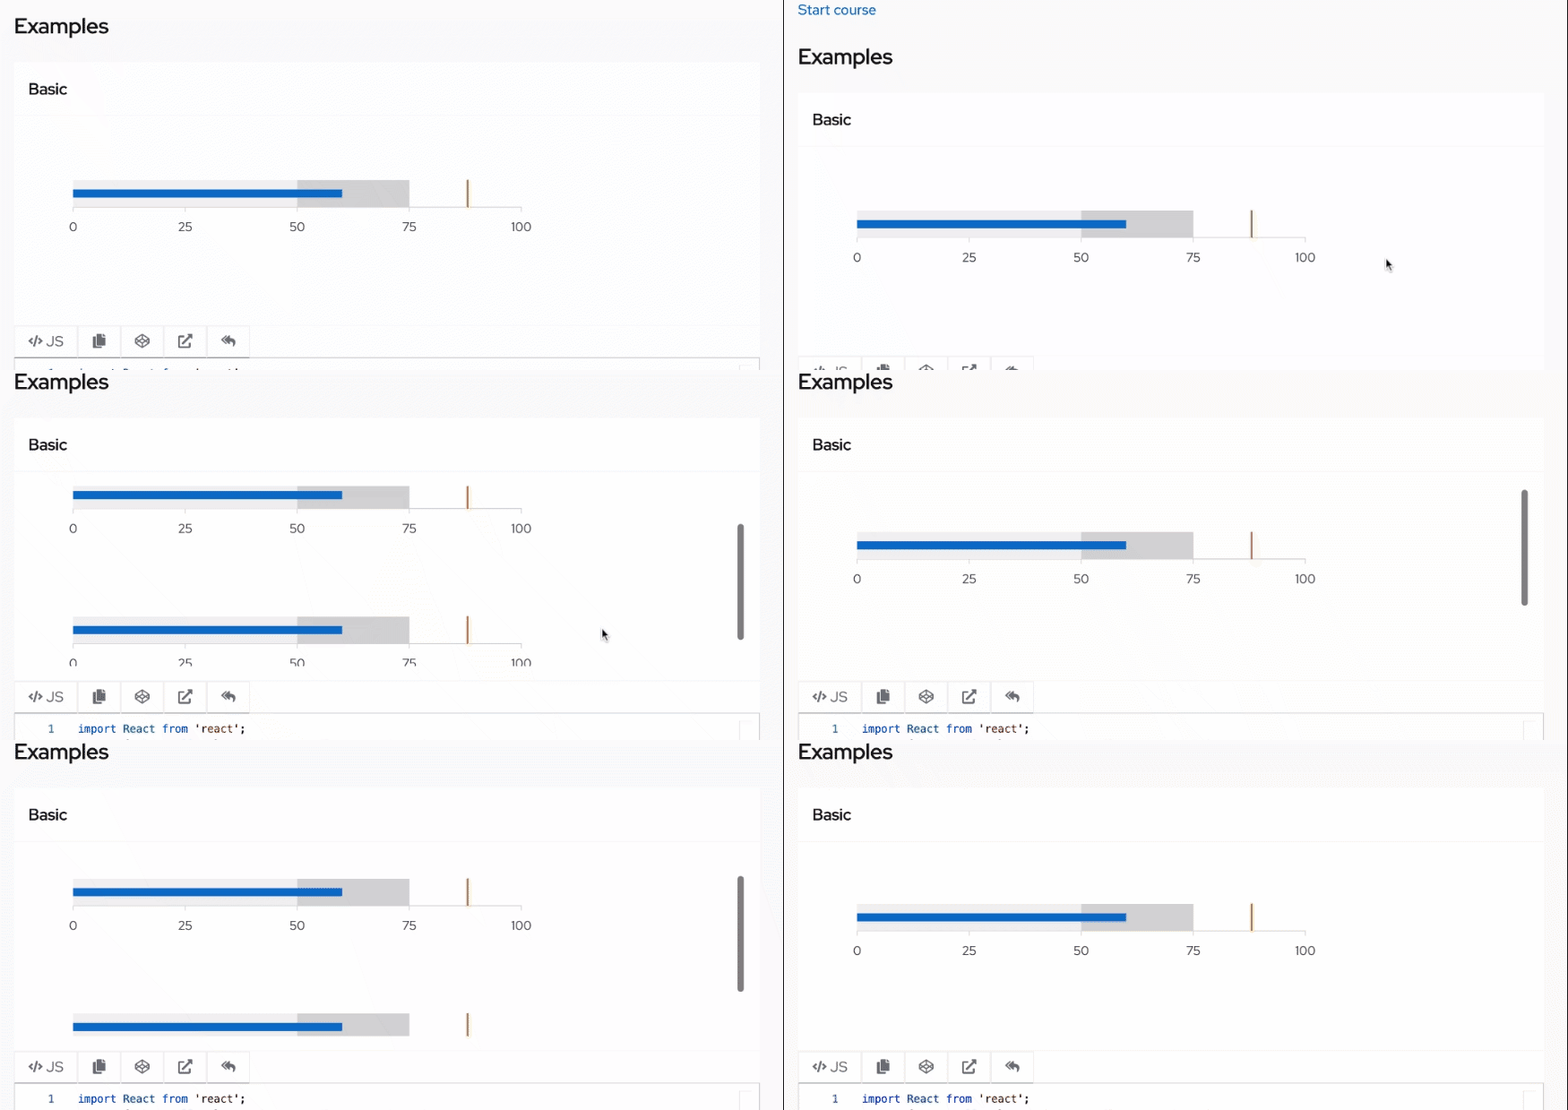
I am using the Patternfly Bulletchart in React. When I try and add more bullet charts to the container, it disappears below the react container rather than allowing a scrollable y axis function. The problem is that the Patternfly graph containers are translated to an SVG which does not allow the container to be scrollable. Is there a way I can make the bullet chart scrollable? I have tried setting the containers to allow for overflow but that does not work.
   <div className="rounded-lg flex flex-col col-span-full xl:col-span-12 bg-white shadow-lg rounded-sm border border-gray-200" >

          <ChartContainer
            height={100}
            width={1200}
          >

            <ChartBullet
              comparativeWarningMeasureData={[{ name: 'Benchmark', y: 78 }]}
              constrainToVisibleArea
              groupSubTitle="Measure details"
              groupTitle="Progress of Each Level"
              height={675}
              labels={({ datum }) => `${datum.name}: ${datum.y}`}

              maxDomain={{ y: 100 }}
              padding={{
                bottom: 100, // Adjusted to accommodate legend
                left: 200, // Adjusted to accommodate labels
                right: 50,
                top: 275 // Adjusted to accommodate group labels
              }}
              qualitativeRangeComponent={
                <ChartBulletQualitativeRange
                  measureComponent={
                    <ChartBar style={{data: { fill: '#A9A9A9' }}} />
                  }
                //  theme={myCustomTheme}
                />
              }
              primarySegmentedMeasureComponent={
                <ChartBulletPrimarySegmentedMeasure
                     theme={this.myCustomTheme}
                />
              }
              primarySegmentedMeasureData={[{ name: 'Measure', y: 15 }, { name: 'Measure', y: 50 }, { name: 'Measure', y: 66}]}
              qualitativeRangeData={[{ name: 'Range', y: 50 }, { name: 'Range', y: 75 }]}
              standalone={false}
              subTitle="Measure details"
              title="Growth Mindset"
              width={1200}
            //  themeColor={ChartThemeColor.multiOrdered}

            />

            ...

